beyond-4pct
Beyond the 4% Rule: A Historical Backtest
Nicky Sandhu · October 25, 2026 · updated October 28, 2026
Summary
Bengen’s 4% rule held up in 1928–2025 history, but it is conservative. Flexible spending with a floor, about 80% stocks, gently front-loaded spending and 25% international stocks doubled the safe starting rate to 8.0% with zero historical failures. The unluckiest retiree still never spent less than roughly Bengen’s $4.
Each row adds one change to the row above. Spending is in today’s dollars per $100 of starting portfolio; “typical” is the median of 69 retirees.
| Change added | Safe starting rate | Typical spending, years 1–10 | Retirees failing (of 69) |
|---|---|---|---|
| Bengen: constant real spending, 50/50 US | 4.0% (max 4.16%) | $4.00 | 0 |
| Guardrails ±30%, $4 floor, 80% stocks | 5.5% | $5.67 | 0 |
| Real spending falls 0.5% a year, floor too | 6.3% | $6.29 | 0 |
| 25% of stocks international | 8.0% | $7.42 | 0 |
| Accept 95% success | 9.0% | $8.02 | 3 |
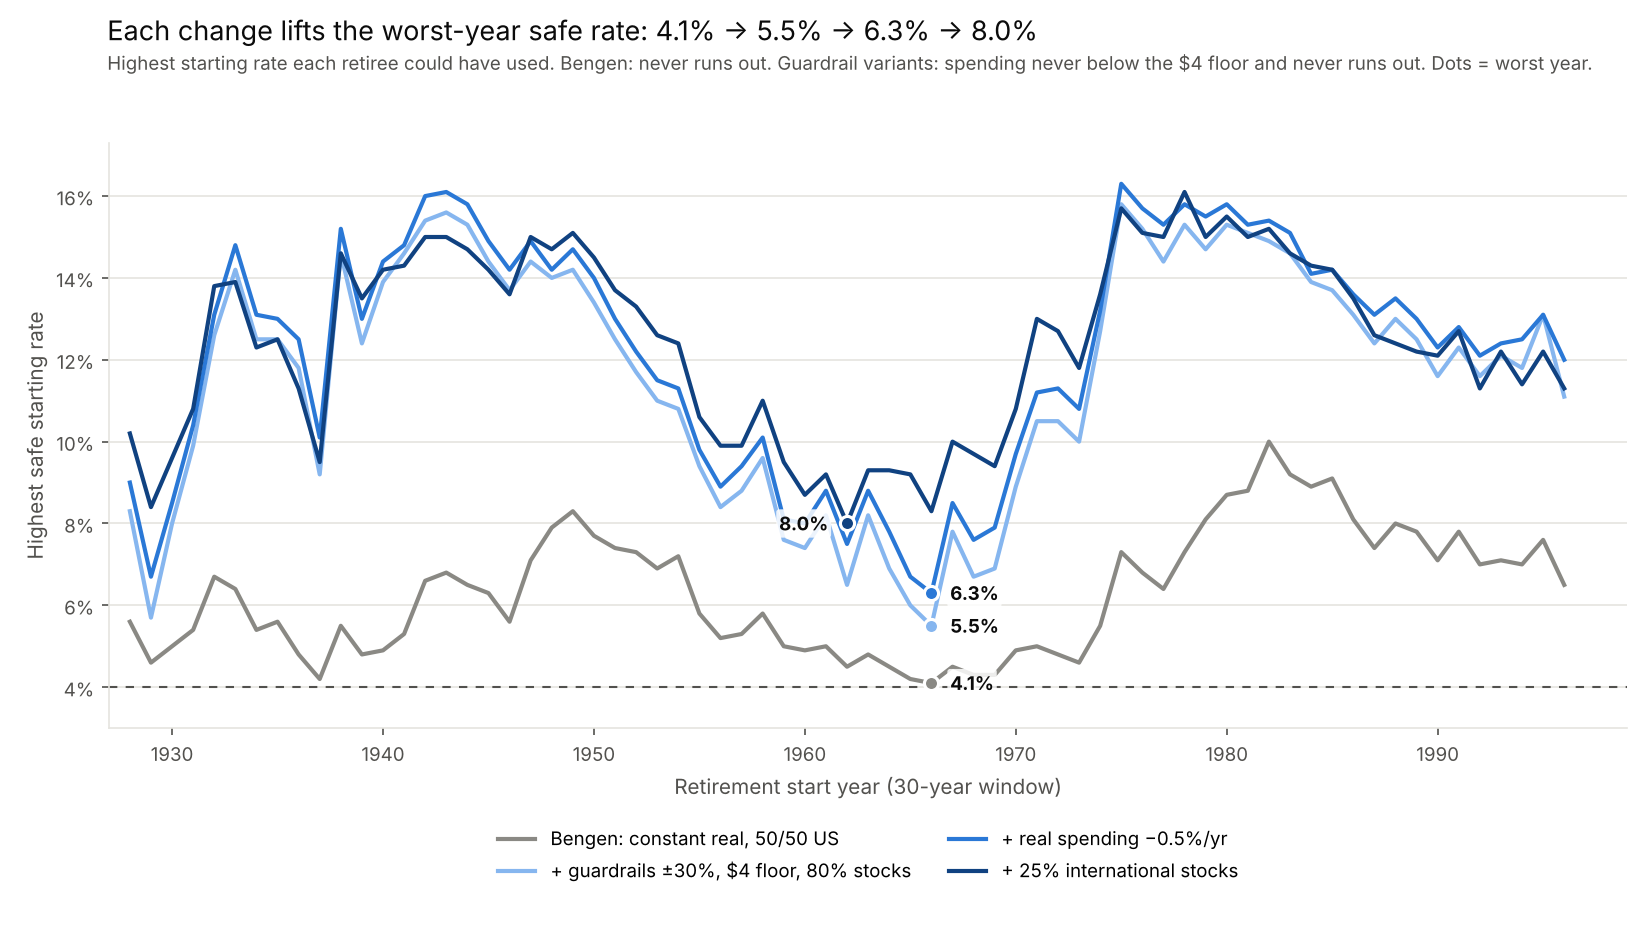
Each line shows the highest starting rate a retiree starting that year could have used; its lowest point is the variant’s safe rate in the table. For the guardrail variants “safe” means spending never fell below the $4 floor and the money lasted, so a high start in a good year (14% in 1980, say) is quickly cut back toward the floor rather than sustained. Mid-1960s starts are the hardest for every variant.
The price of the higher start is variable income. For the 8% plan, the unluckiest 5% of retirees reach the floor by year 6 and stay there, and typical spending drifts down over time. A realistic target is probably 1–1.5 points below these optimized figures.
Recommended plan. Measured by how retirees actually experience spending, the 8% plan cuts too deep: 45% of retirees end up 50% below plan. The plan we now recommend spends the way retirees actually do (about 1% less each year after inflation, following Blanchett’s 2014 research), never more than 10% above that path, and never below $27,300 per $1 million saved. It starts at $65,000 per $1 million (6.5%) with 80% stocks, and only 2% of 5,000 retirements reshuffled from real history run out, against 13.7% for our earlier 6.1% plan with a 75% floor. That earlier plan was tuned too closely to the 69 historical retirements; see Testing beyond history. Details in Recommended plan.
Method and data
Every result comes from 69 overlapping 30-year retirements starting each January from 1928 to 1996, run on actual annual returns. A retiree succeeds if real spending never drops below the floor and the money never runs out.
- Portfolio starts at $100, rebalanced to a fixed mix each year; withdrawals at year end; no fees or taxes.
- Bengen rule: first-year spending = rate × portfolio, then raised by inflation every year.
- Guardrails rule: spending rises with inflation, then is cut by the step if the current withdrawal rate is more than 20% above the starting rate, or raised by the step if more than 20% below. The step is the largest real change in any one year.
- Floor and ceiling: spending never goes below the floor ($4) or above an optional cap. With a declining plan, the floor declines at the same 0.5% a year, to $3.46 by year 30.
| Series | Source | Notes |
|---|---|---|
| US stocks | Damodaran, S&P 500 total return, 1928–2025 | |
| Bonds | ½ 3-month T-bills + ½ 10-year Treasury (Damodaran) | Proxy for Bengen’s intermediate-term government bonds |
| Inflation | US CPI-U, December to December | |
| International stocks, 1928–69 | Jordà-Schularick-Taylor Macrohistory R6 (CC BY-NC-SA 4.0), 15 developed countries in USD, weighted by real GDP | Wartime gaps skipped; a stress version fills them with heavy losses |
| International stocks, 1970–2025 | MSCI World ex USA, USD total return | Within ~2 points a year of MSCI EAFE |
Bengen’s result replicates
The rebuilt study matches Bengen (1994): with a 50/50 portfolio, the worst start year is 1966 and the highest rate lasting 30 years is 4.16%, against his roughly 4.15%. A 4% withdrawal lasted at least 32.9 years for every retiree.
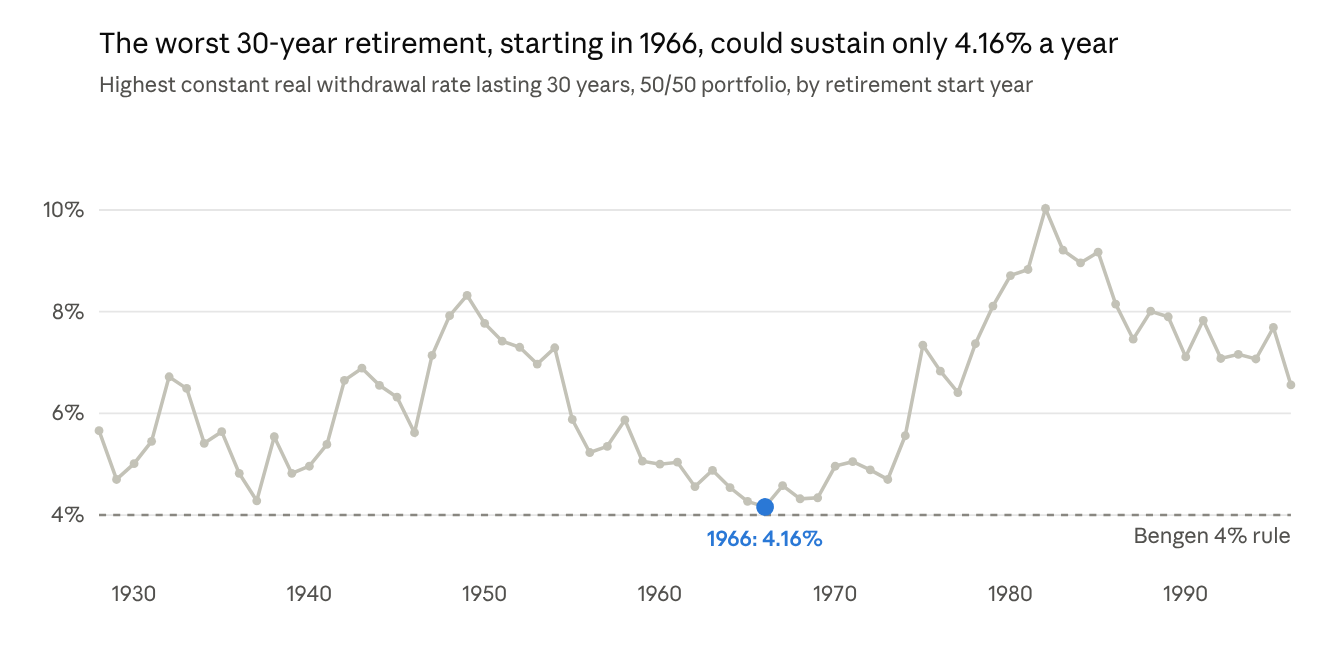
Computed from Damodaran S&P 500 and bond returns and US CPI · 69 retirements starting 1928–1996
The typical retiree could have spent about 6.4%; 4% is set entirely by the late-1960s starts. As in the paper, 3% lasted 50 years in every case, 5% survived 30 years in only 63% of cases, and 50–75% stocks gave the longest worst-case life. Using 10-year Treasuries instead of the shorter-bond proxy lowers the 1966 figure to about 4.0%.
Guardrails need a floor
Guardrails on their own made things worse. Without a floor, cuts compound in a bad stretch and rarely reverse: starting at 4%, the 1965–66 retirees ended up spending about $1.90 a year while still holding roughly their starting balance.
Adding a floor turns flexibility into a gain. On a 50/50 US portfolio starting at 5%:
| Spending rule | Retirees failing | Worst year’s spending | Typical average spending |
|---|---|---|---|
| Constant real (Bengen) | 17 | $0 | $5.00 |
| Guardrails ±10%, no floor | 0 | $2.15 | $4.91 |
| Guardrails ±20%, floor at 80% of start | 0 | $4.00 | $4.87 |
| Guardrails ±10%, floor at 80% of start | 1 | $2.31 | $4.91 |
Small steps and a floor do not mix: cuts come too slowly, the floor props spending up, and the 1966 retiree runs dry in the last year. Larger steps (20–30%) with a floor worked best throughout.
How the ±30% guardrails work
The guardrails change spending only when the withdrawal rate drifts well away from where it started, and then by 30% at once. In most years nothing happens beyond the inflation raise.
Each January, for the 8% plan:
- Planned spending: last year’s spending, raised by inflation, then trimmed 0.5%.
- Check: withdrawal rate = planned spending ÷ current portfolio.
- Act only outside the band: above 9.6% (the starting 8% plus 20%) spending is cut 30%; below 6.4% (8% minus 20%) it is raised 30%. In between, nothing changes.
- Limits: spending never goes below the $4 floor (itself declining 0.5% a year) or above the 2× cap, whatever the rule says.
“±30%” is the size of the move; the 6.4–9.6% band is what triggers it.
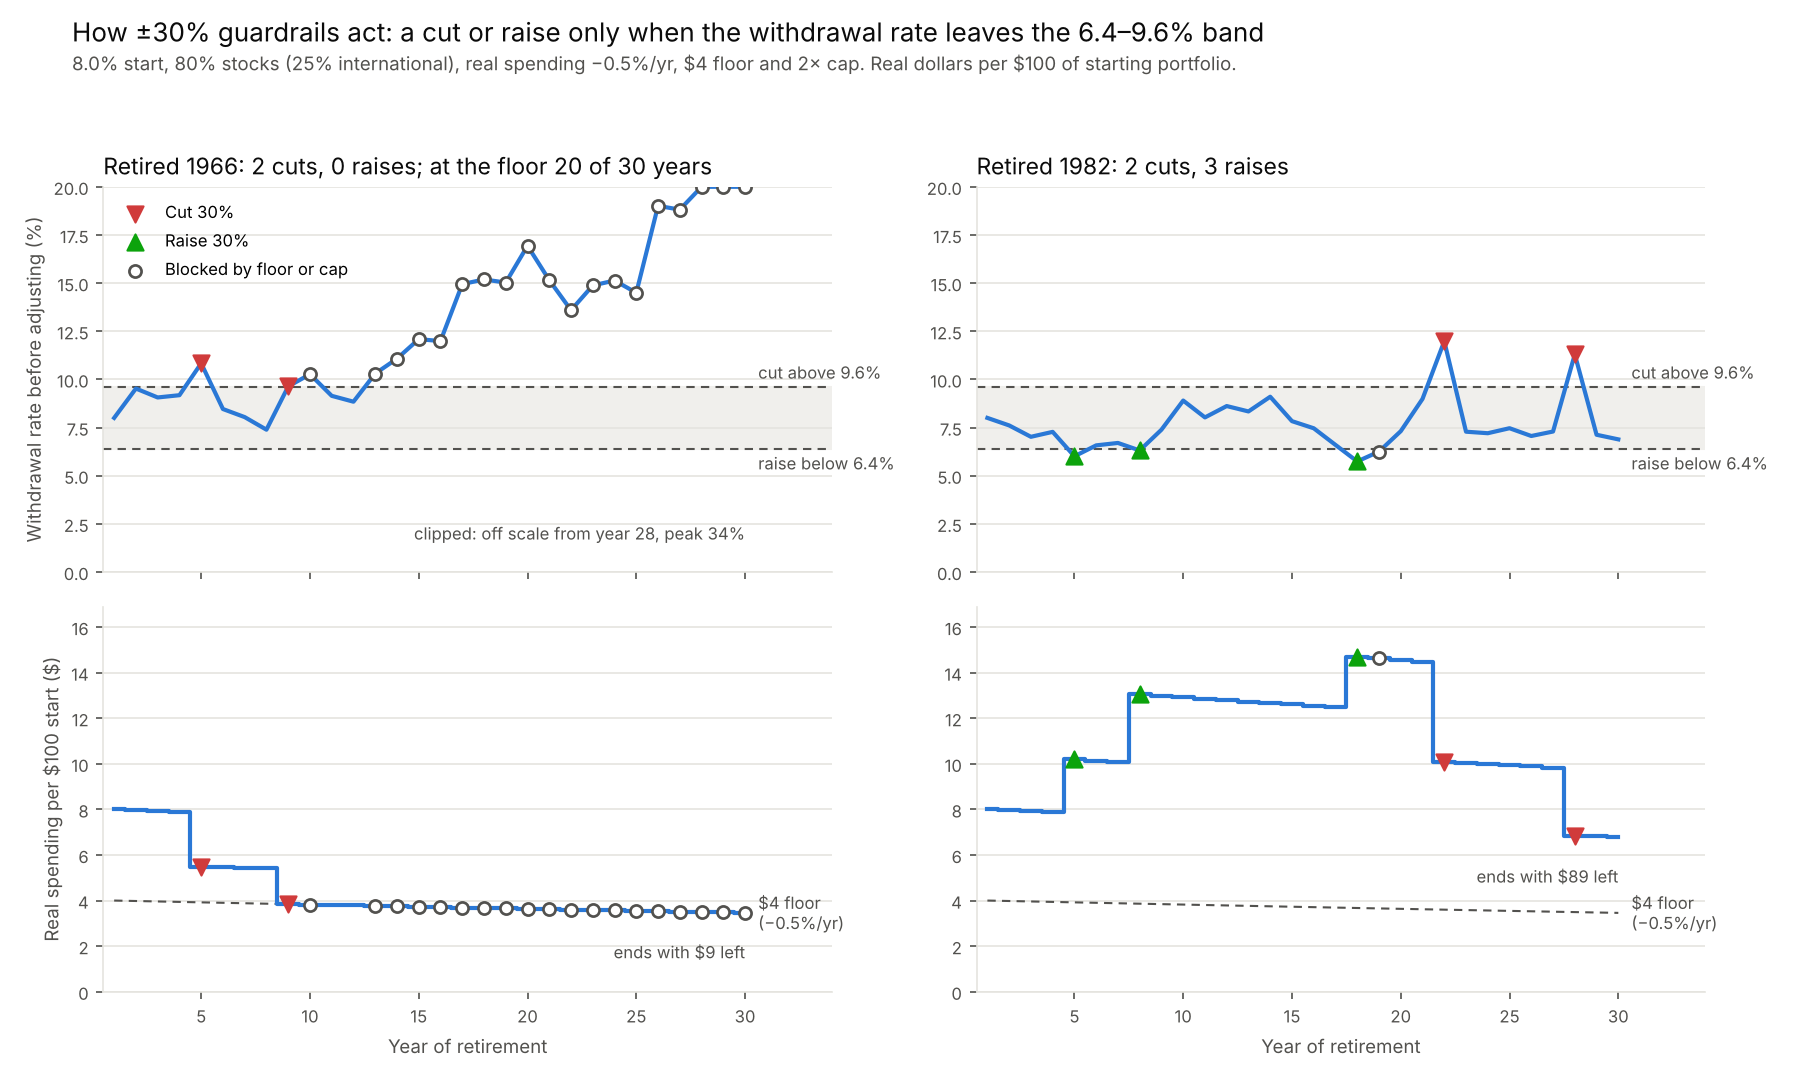
8.0% start, 80% stocks (25% international), real spending −0.5% a year, $4 floor, 2× cap. Hollow circles: a cut or raise was triggered but the floor or cap stopped spending from moving.
- 1966, a bad start. Spending was cut 30% in year 5 and again in year 9, which brought it to the floor. It stayed there for 20 of the 30 years while the withdrawal rate climbed to 34%; the floor blocked every further cut. The portfolio ended with $9 left: tight, but it never ran out.
- 1982, a good start. Spending was raised three times, to about $14.70 by year 18, then cut twice after the 2000s crashes. It still ended at $6.80 a year with $89 left.
Across all 69 retirees on this plan:
- Every retiree had at least one cut, typically three in 30 years, the first around year 6. Raises were as common, typically three.
- About 68% of years had no change beyond inflation and the 0.5% trim; about 10% had a cut and 10% a raise.
- 31 of the 69 retirees spent some years pinned at the floor.
Large steps win because small ones react too slowly: the portfolio drains before the cuts add up, and the floor then holds spending too high. Above 25% the step size barely matters:
| Guardrail step | Safe starting rate | Typical spending, years 1–10 |
|---|---|---|
| ±10% | 7.0% | $6.85 |
| ±20% | 7.7% | $7.17 |
| ±25% | 8.0% | $7.29 |
| ±30% | 8.0% | $7.42 |
±25% gives the same 8.0% safe start with gentler swings, at a cost of about $0.13 a year of early spending. For someone who would find a 30% pay cut in one year hard to live with, it is the better choice.
Allocation, front-loading, ceiling and leverage
With a $4 floor and guardrails, about 80% stocks gave the most spending with zero failures; front-loading helped only when the minimum also declined; a ceiling and leverage did not help. Figures below are US-only stocks.
- About 80% stocks. 80% stocks with ±30% steps supported a 5.5% start and $6.70 typical lifetime spending, with no failures. At 90% stocks or more, the 1929 retiree fails every combination: even a flat 4% at 100% stocks runs out after about 21 years.
- Front-loading needs a declining floor. Planning real spending to fall 0.5% a year lifted the zero-failure start from 5.5% to 6.3% only because the floor fell with it. With a flat $4 floor the drift added nothing: the worst retirees sit on the floor either way.
- A ceiling never raised the starting rate. The binding retirees never reach the cap. A cap only trades late splurges for a larger estate: at 95% success, a 1.25× cap raised the median ending balance from $79 to $92 per $100.
- Leverage failed. Holding 125%, 150% or 200% in stocks, financed at the T-bill rate plus 1%, failed at least 4, 9 and 16 of 69 retirees respectively. The early-1930s and late-1960s starts were wiped out.
International diversification
Moving a quarter of the stocks abroad was the largest single gain: the zero-failure starting rate rose from 6.3% to 8.0% for the same strategy.
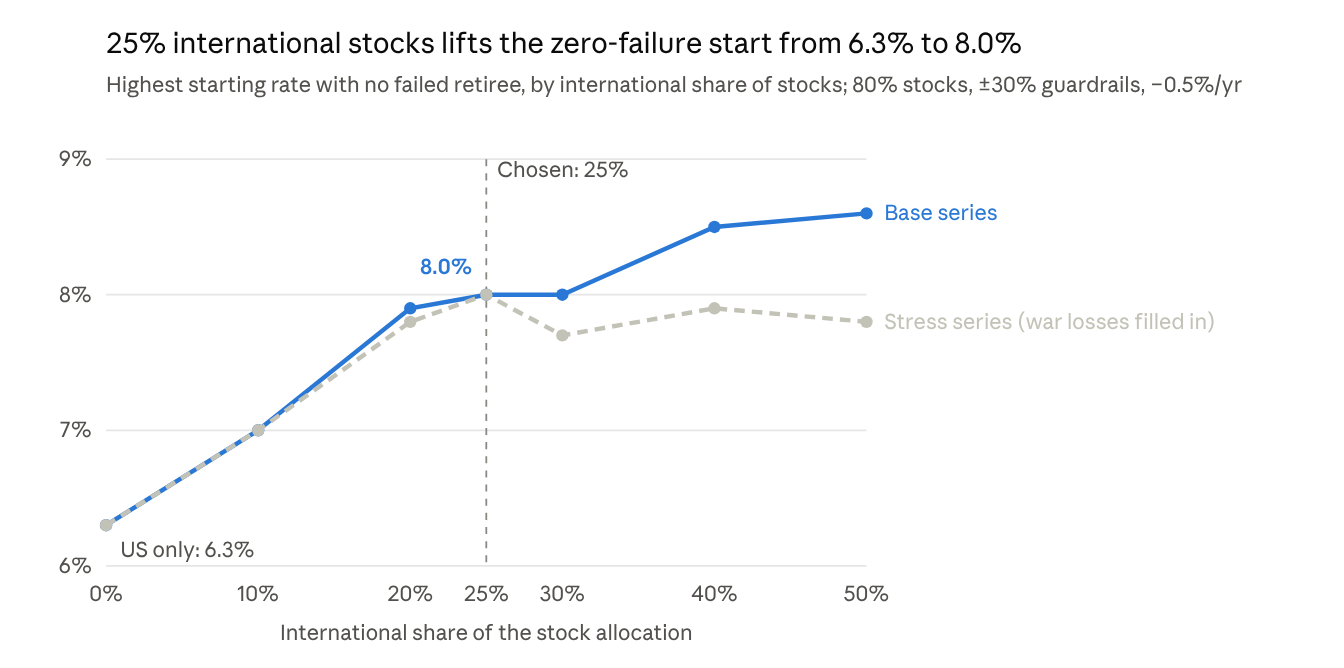
Computed from Damodaran, JST Macrohistory R6 and MSCI World ex USA returns · 69 retirements starting 1928–1996 · 2× cap, declining $4 floor
- No return given up. Over 1928–2025 a 75/25 US/international stock mix compounded at 10.0% a year, the same as US-only, with volatility down from 19.4% to 17.9%. The two markets’ annual returns were only 0.6 correlated.
- It rescues 1966. International stocks held up far better through the 1970s and early 1980s, when US stagflation sank the 1966 retiree.
- It survives the stress tests. Filling the wartime data gaps with heavy losses (Japan 1946–47, Germany 1945, occupied Netherlands and Norway) leaves 25% unchanged at 8.0%. Even if international stocks had only matched US returns over 1970–89, the start still rises to 7.1%.
- About 25% is enough. Beyond it, the base series gains a little more but the stress series does not.
Accepting 95% success
Allowing 3 failures in 69 retirements (95.7% success) raised the start from 8.0% to 9.0%. Typical first-decade spending rose from $7.42 to $8.02. Plan: 80% stocks (25% of them international), ±30% guardrails, 2× cap, real spending −0.5% a year.
The three failures are the 1929, 1962 and 1966 starts. Each holds the floor for decades, then runs out in year 26, 28 or 30.
Higher starts front-load more than the plan’s 0.5% drift suggests:
| Median spending in each year, averaged by decade | Start 8.0% (100% success) | Start 9.0% (95% success) |
|---|---|---|
| Years 1–10 | $7.55 | $7.97 |
| Years 11–20 | $6.37 | $5.93 |
| Years 21–30 | $5.34 | $4.74 |
| Share of all retiree-years spent at the floor | 19% | 19% |
The most aggressive plan without leverage was 100% stocks with ±25% steps: a 9.2% start and $8.44 typical first-decade spending, with the 1928 and 1929 starts failing.
What it feels like: how often spending is cut
The higher starting rates are paid for with frequent deep cuts: most retirees on the aggressive plans lived through a cut of 30% or more, while Bengen’s 4% never cut at all.
Each retiree is placed in a level by their deepest real spending cut, measured two ways:
- Below the plan: the deepest drop below planned spending. For the declining plans the planned 0.5% annual trim is not counted as a cut.
- From the best year: the deepest drop from the highest spending reached so far, so giving back earlier raises counts.
Levels: none (under 5%), mild (5–15%), moderate (15–30%), severe (30–50%), extreme (50% or more), and ran out of money. Shares are of the 69 historical retirees; because the 30-year windows overlap, they are frequencies, not true probabilities.
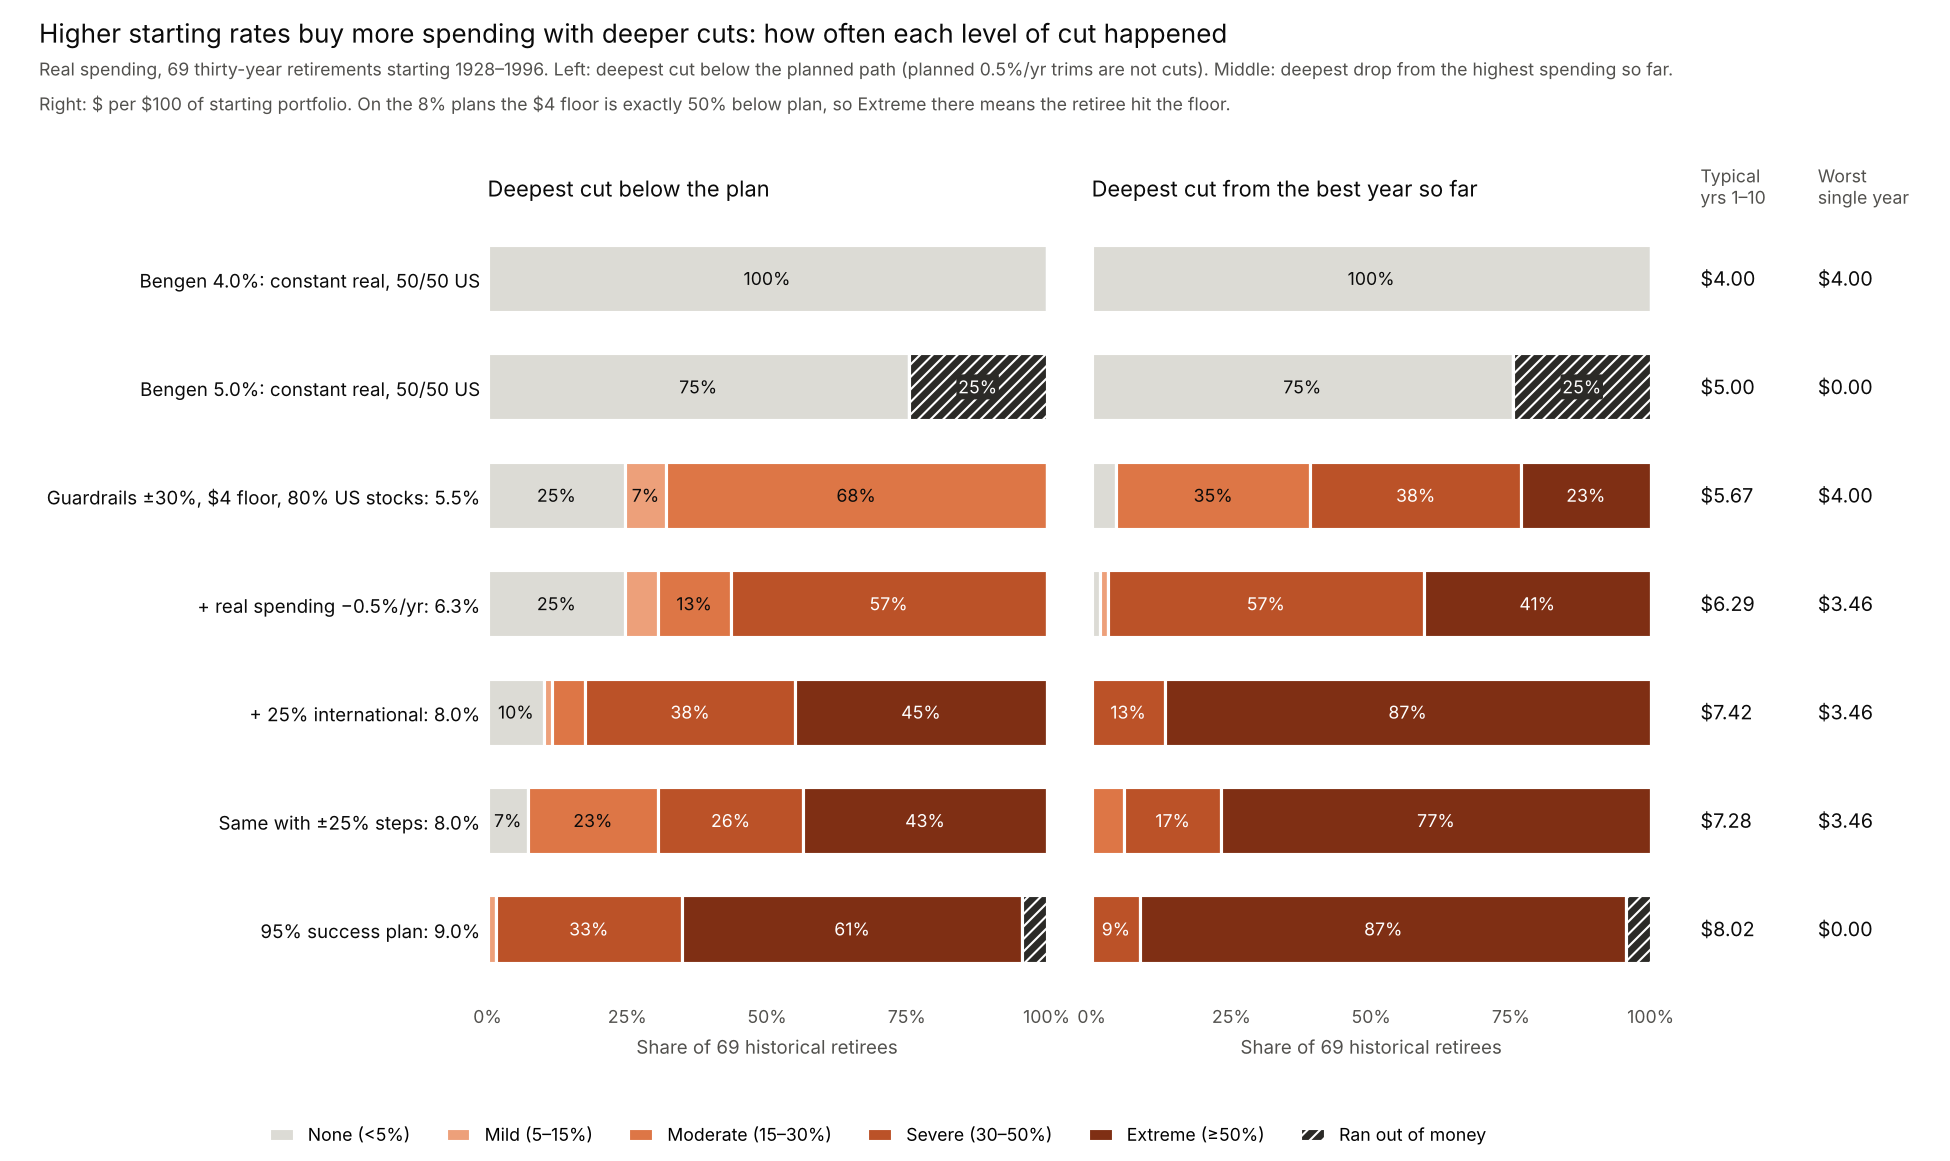
On the 8% plans the $4 floor is exactly 50% below plan, so “extreme” there means the retiree hit the floor.
| Strategy | Typical spending, yrs 1–10 | Cut ≥30% below plan | Cut ≥30% from best year | Years ≥15% below plan (median) |
|---|---|---|---|---|
| Bengen 4.0% | $4.00 | 0% | 0% | 0 |
| Bengen 5.0% | $5.00 | 25% (ran out) | 25% (ran out) | 0 |
| Guardrails, US, 5.5% | $5.67 | 0% | 58% | 6 |
| + real spending −0.5%/yr, 6.3% | $6.29 | 57% | 97% | 6 |
| + 25% international, 8.0% | $7.42 | 83% | 100% | 14 |
| Same with ±25% steps, 8.0% | $7.28 | 70% | 94% | 13 |
| 95% success plan, 9.0% | $8.02 | 97% | 100% | 18 |
“Cut ≥30%” includes retirees who ran out of money.
- Rigid spending hurts differently. Bengen at 5% never cuts, but a quarter of retirees ran out of money, usually in the last five years. Guardrails trade that rare total loss for common partial cuts.
- The US guardrails plan at 5.5% is the gentlest step up. No retiree fell more than 27% below plan, because the $4 floor sits close to the $5.50 start; the cost is about 6 years spent 15% or more below plan.
- The 8% plan doubles spending, but nearly half of retirees hit the floor, a 50% cut, and a typical retiree spends 14 of 30 years at least 15% below plan.
- Giving back raises is almost universal. On the flexible plans nearly everyone at some point loses 30% or more from their best year, usually by losing earlier raises. Anyone who lets their lifestyle rise with every raise will feel that as a real cut.
- ±25% steps soften it a little: fewer severe cuts (70% against 83%) and one year less below plan, for $0.14 a year less early spending.
Does a cash bucket help?
A cash bucket used in down markets barely moves the safe starting rate: about +0.15–0.2 points on the 8% plan and nothing on Bengen’s rule. It slightly softens the worst outcomes.
The rule tested:
- Funding: cash comes out of bonds (80/20 becomes 80/10/10) and earns the T-bill rate.
- Trigger: a downturn is when stocks are 10% or more below their previous peak.
- In a downturn: spending comes from cash first, then bonds, for up to 5 years; stocks are not sold and the portfolio is not rebalanced.
- Refill: afterwards, cash is topped up by a fifth of its target in each year stocks rose.
To separate the timing rule from simply holding cash, it is compared with no cash and with a static 10% cash share rebalanced every year.
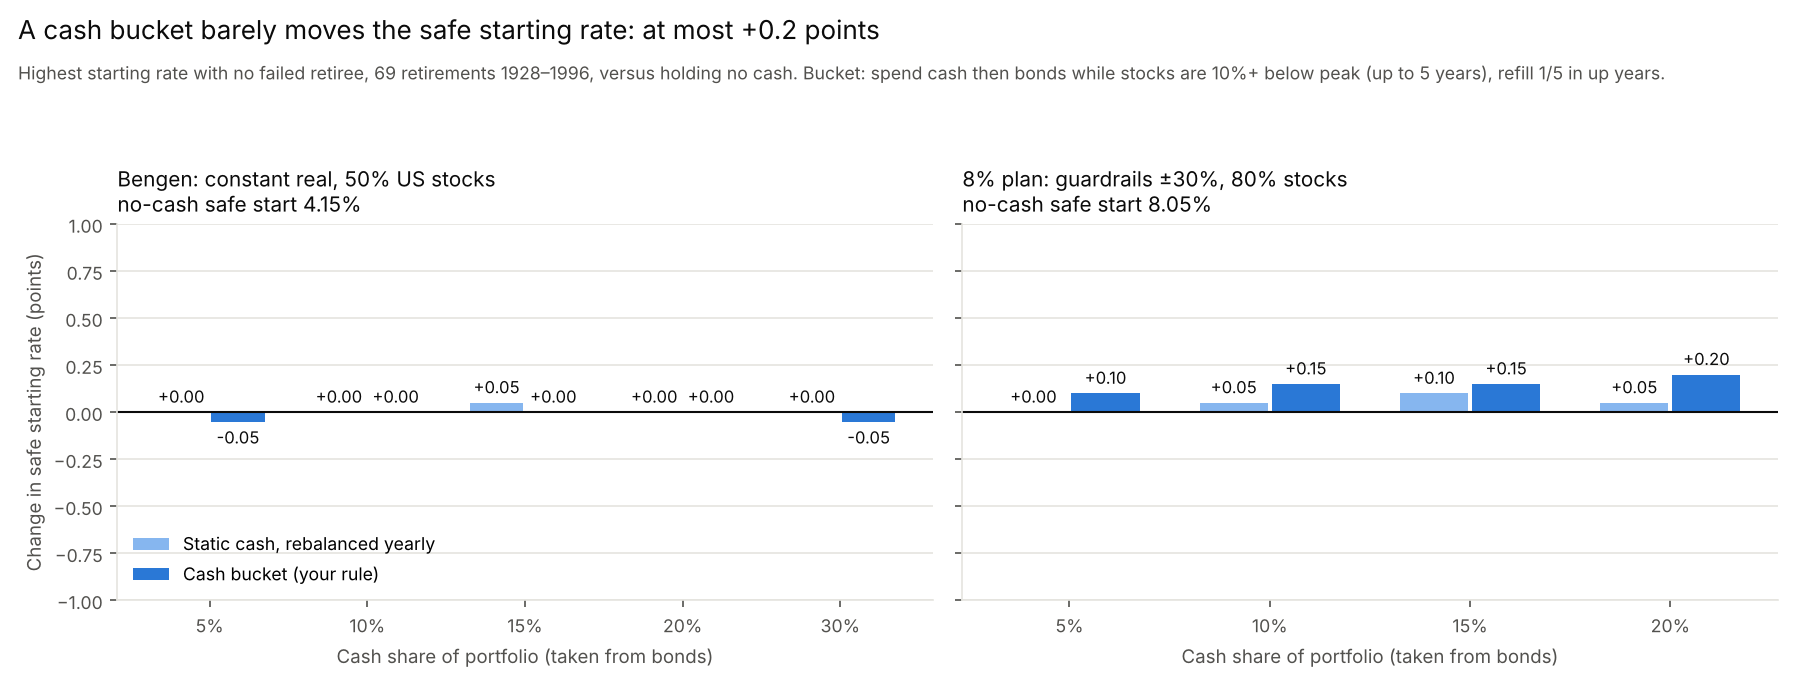
| No cash | Static 10% cash | 10% cash bucket | |
|---|---|---|---|
| Bengen, 50% stocks: safe start | 4.16% | 4.18% | 4.14% |
| 8% plan: safe start, no failures | 8.06% | 8.12% | 8.20% |
| 8% plan: safe start, 95% success | 9.02% | 8.74% | 9.22% |
| 8% plan at 8%: retirees cut ≥30% below plan | 77% | 78% | 74% |
| 8% plan at 8%: worst ending balance | $2 | $4 | $6 |
| 8% plan at 8%: median ending balance | $62 | $60 | $67 |
| 8% plan at 8%: typical spending, yrs 1–10 | $7.42 | $7.36 | $7.36 |
Why it barely helps:
- 10% is not much money. On the 8% plan it covers about 1.25 years of spending; the bad stretches lasted many years.
- It misses the worst retirees. The 1966 retiree’s damage came in the 1970s, long after the first dip had drained the cash. Varying the cash from 5% to 20% of the portfolio, or the trigger from 0% to 20% below peak, never added more than about 0.35 points.
- Rebalancing already does the job. In a down year annual rebalancing buys stocks rather than selling them, so the bucket’s gain over plain cash is about 0.1 point.
This matches the published research. Estrada (2018) found buckets did worse than a static mix across 21 countries, and Woerheide and Nanigan found cash buffers raised failure rates. Early Retirement Now found buckets help only with 6–10+ years of spending in cash, set up at a market peak. A bucket’s main value is behavioural: not having to sell stocks in a crash, at almost no cost.
Recommended plan: spend like retirees do, cap the good years
The recommended plan keeps the chance of running out near 2% while spending follows the pattern retirees actually show. Per $1 million saved, in today’s dollars:
- Start at $65,000 (a 6.5% withdrawal) with 80% stocks, 30% of them international, and 20% bonds.
- Plan for spending to follow Blanchett’s (2014) curve for a household spending about $75,000 a year: about −1% a year after inflation on average, gentlest in the 60s and late 80s and steepest around age 78, 27% lower after 30 years. Household data show real spending falling 0.96% a year from 60 to 90; J.P. Morgan’s data on 4.7 million households show it more than 30% lower at 85 than at 60.
- Adjust against the 6.5% starting withdrawal rate: if planned spending is more than 7.9% of the current portfolio (22% above the start), cut it 8.5%; if less than 5.1% (22% below), raise it up to 15%.
- Cap: never spend more than 10% above the planned path.
- Floor: never below $27,300 (42% of the first year). Money left over is the reserve for late-life long-term care.
A practical guide to running the rule each January, with the planned change for every age and two worked retirements, is in Following the recommended plan, year by year.
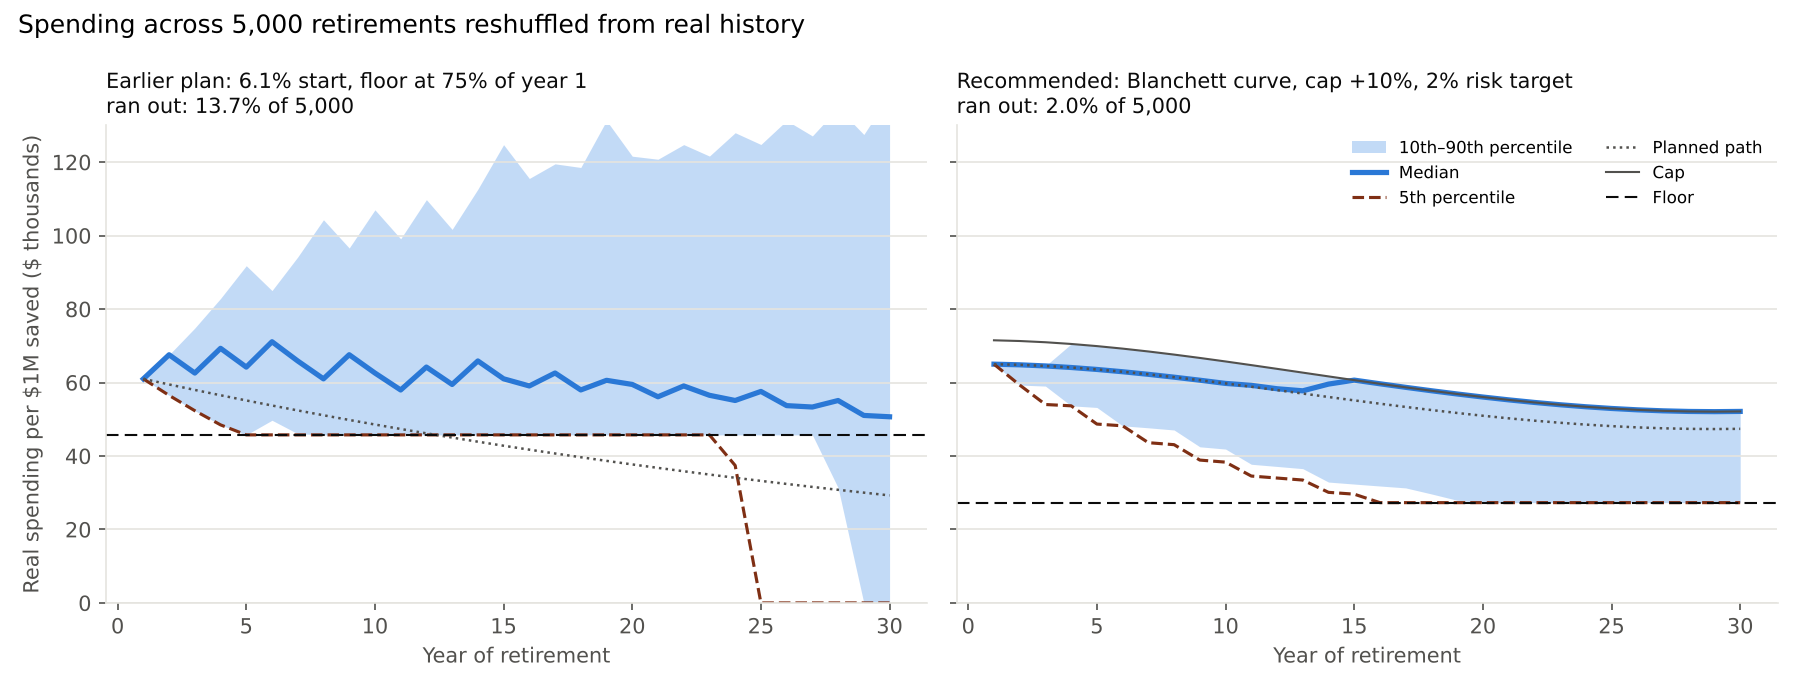
Reshuffled history: 5,000 synthetic 30-year retirements stitched from random runs of real years (10 on average) from 1928–2025, with stocks, bonds and inflation moving together. They include many bad sequences that never happened but could have.
| Per $1M saved | Recommended plan | Earlier plan (6.1%, 75% floor) | Bengen 4% |
|---|---|---|---|
| First-year spending | $65,000 | $61,000 | $40,000 |
| Floor (never below) | $27,300 | $45,750 | none |
| Typical spending, year 1 / 10 / 20 / 30 | $65,000 / $59,800 / $56,100 / $52,100 | $61,000 / $62,600 / $59,500 / $50,700 | $40,000 flat |
| Ran out: 69 real retirements (no fee / 0.25% / 0.5% fee) | 0 / 0 / 0 | 1 / 6 / 9 | 0 / 0 / 1 |
| Ran out: reshuffled history (no fee / 0.25% fee) | 2.0% / 2.8% | 13.7% / 16.3% | 4.9% / 6.2% |
| Ever spend below $30,000 (reshuffled) | 23% | 14% | 5% |
| Score, reshuffled history ($ per $100) | $4.87 | $5.00 | $3.92 |
| Typical balance at year 30 (reshuffled) | $1.09M | $0.73M | $1.23M |
Typical = median retiree. Score: certainty-equivalent spending with risk aversion 3, each year weighted by the chance that at least one of a 65-year-old couple is alive (SSA 2022 period life table).
- A lower floor is what makes it safe. The earlier plan promised never to fall below $45,750 and drained the account in about 1 retirement in 7 when history didn’t repeat itself exactly. With the floor at $27,300, about 1 retiree in 4 has a lean stretch below $30,000 after a bad start, but only 1 in 50 runs out.
- The cap keeps the smile. Without it, raises in good markets pushed typical spending up over time, against the declining pattern; capped at 10% above the path, typical spending follows the curve down, and the plan can start $7,000 higher than an uncapped version.
- The cost is a slightly lower score. Good-year money stays invested, so the score is a little below the earlier plan’s ($4.87 vs $5.00), and the typical retiree ends with about as much as they started with.
Testing beyond history: why the plan changed
The earlier plan was tuned on the same 69 overlapping retirements it was scored on, which hold only about three truly independent 30-year periods. Three checks showed it was fitted too closely:
- Fees: a 0.25% yearly fee raised its run-outs from 1 to 6 of 69 (the 1929 and 1960s starts).
- Reshuffled history: 13.7% of 5,000 reshuffled retirements ran out.
- Split sample: the same rule tuned on 1928–61 starts ran out for 10 of the 35 later retirees.
The weak point was the floor. $45,750 per $1 million, never cut, is above the roughly $40,000 that history has supported as spending that never falls, and buying it as a real guarantee (a 30-year TIPS ladder at about 2% real) would cost more than the whole portfolio.
Bengen’s 4% rule out of history. The same reshuffled retirements, run with Bengen’s exact rule (fixed real spending, 50/50 US stocks and bonds), turn 4% from a rate that never failed into one that survives about 95% of the time (scripts/bengen_bootstrap.py).
| 50/50 US stocks and bonds | Real history (69) | Reshuffled (5,000) |
|---|---|---|
| Ran out at 4% | 0% | 4.9% |
| Rate that survives 99% / 95% / 90% of the time | 4.24% / 4.33% / 4.58% | 3.38% / 4.02% / 4.41% |
| Typical retiree’s highest rate | 6.41% | 6.19% |
| Worst case | 4.16% (1966) | 2.59% |
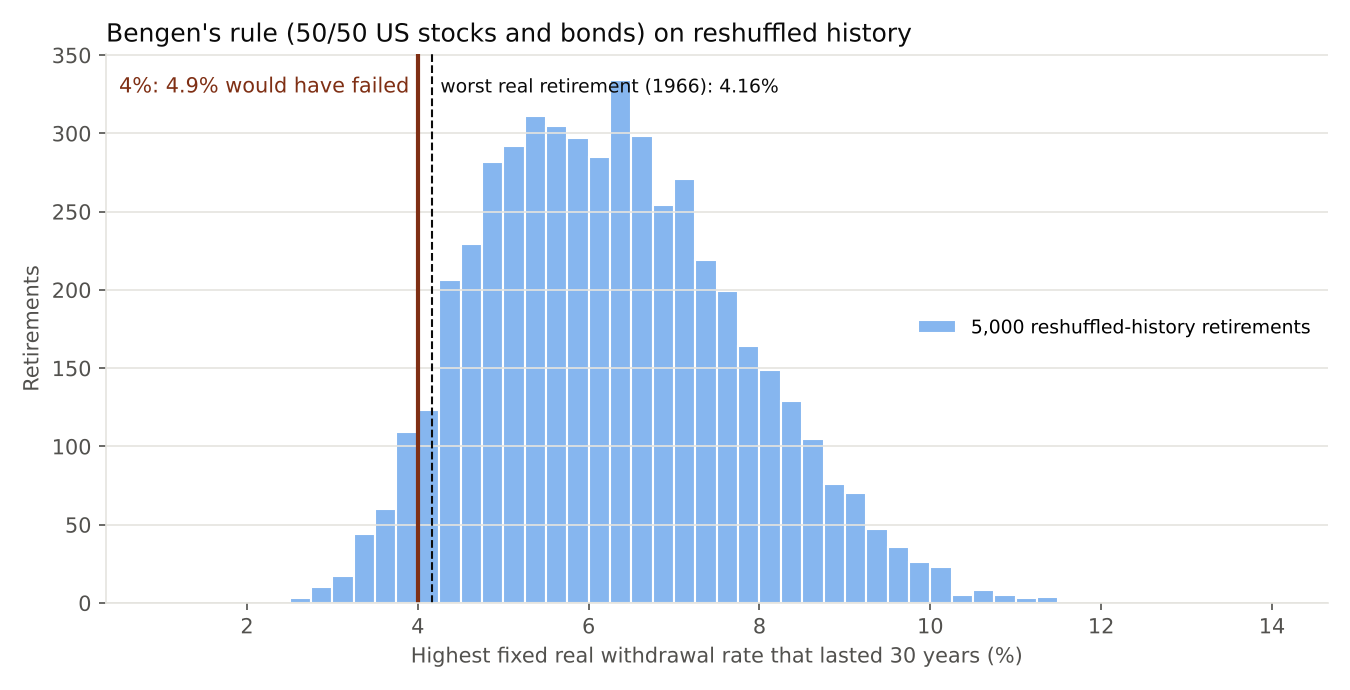
- To fail no more than 1 time in 100, the rate drops to about 3.4%.
- 50–75% stocks is still the safest mix: at 4%, 12.2% ran out with 25% stocks, 4.4% with 60%, 6.7% with 100%.
- The answer depends on how history is reshuffled: 4% fails 2.9% of the time with 20-year runs of real years, 4.9% with 10-year runs and 7.2% with single random years, so roughly 3–7%.
Strategies from the literature. On the same engine and score we tested amortization rules (Bogleheads’ ABW and VPW, TPAW-style), a CAPE-aware amortization rule and Early Retirement Now’s CAPE rule, Vanguard’s dynamic spending rule, a rising-stock glidepath, and a TIPS-ladder floor with stock upside. Each was tuned twice: on the 69 real retirements, and on 2,000 reshuffled ones, then scored on 5,000 fresh reshuffled retirements.
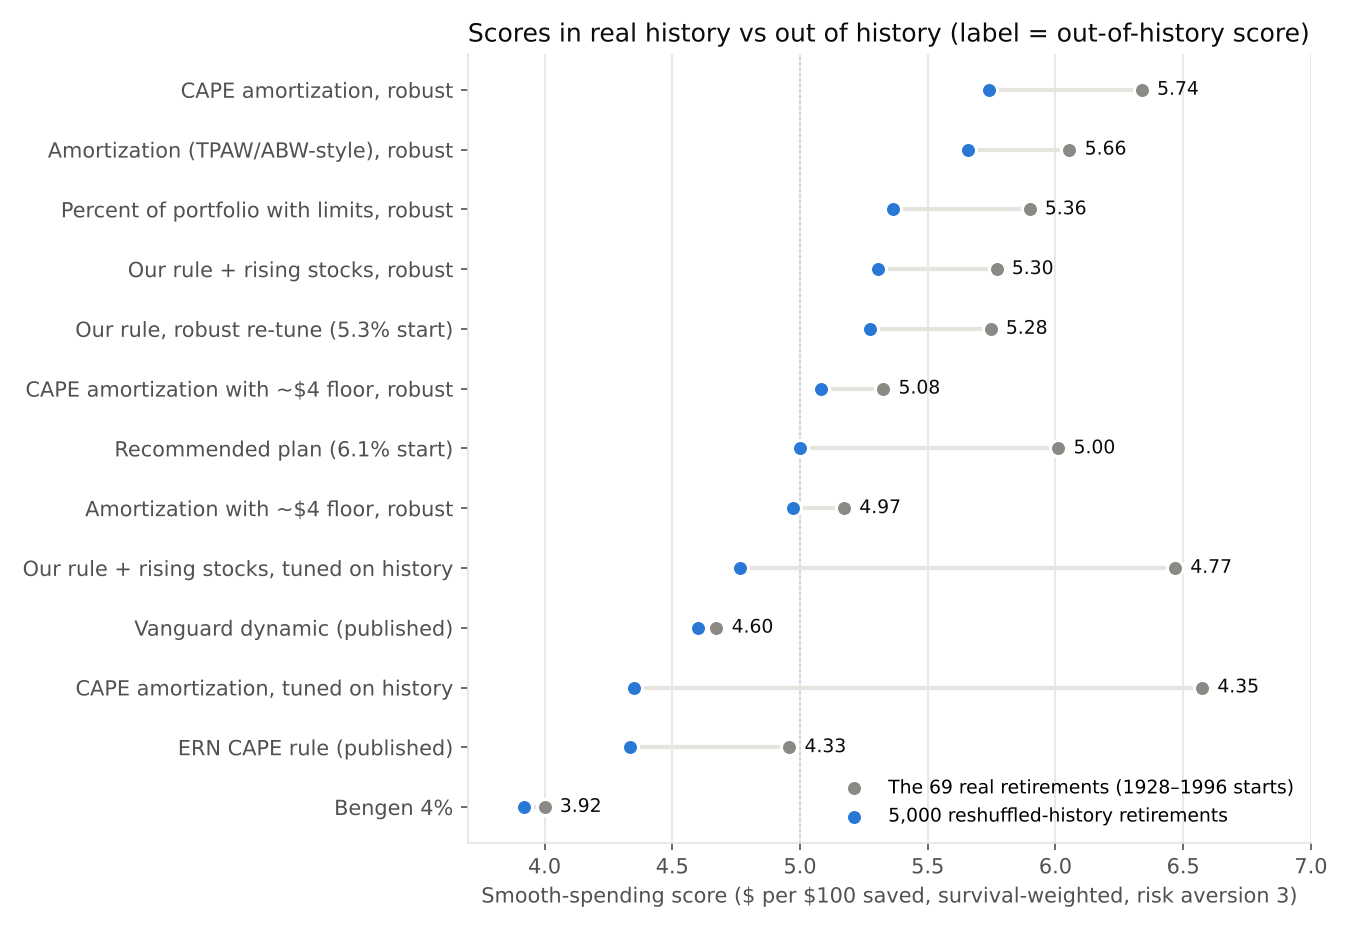
- History flatters. CAPE amortization (+9%) and a rising glidepath (+8%) beat the earlier plan in real history, then fell below it out of history and ran out in about 20% of reshuffled retirements.
- With a hard floor, our rule wins. Tuned on reshuffled history, our rule (planned path, cuts and raises outside a band, floor) beat amortization, CAPE amortization and percent-of-portfolio rules given the same protection.
- Without a hard floor, amortization scores higher. About 7% more, and fewer run out (2.8%), but a third of retirees spend below $39,000 at some point. Adding CAPE gained only about 1.5% more, not worth the valuation-model risk. This matches Kitces and Income Lab on the value of risk-based adjustments over fixed guardrails.
- Glidepaths and TIPS ladders add little here. A robustly tuned glidepath added about 0.4%; a TIPS ladder can’t fund a useful floor at today’s real yields.
How the plan was set. All settings, including the floor, were tuned on 2,000 reshuffled retirements to maximise the score with at most 2% running out, and checked on 5,000 fresh ones, real history and fees. Caps of 1%, 2%, 3% and 5% were tried: 2% gave most of the safety without pushing the floor too low (at 1% it falls to about $21,000–24,000), and looser caps barely raised the score. The spending path was then fixed to Blanchett’s curve and the cap added, as above.
Experiments that didn’t make the cut
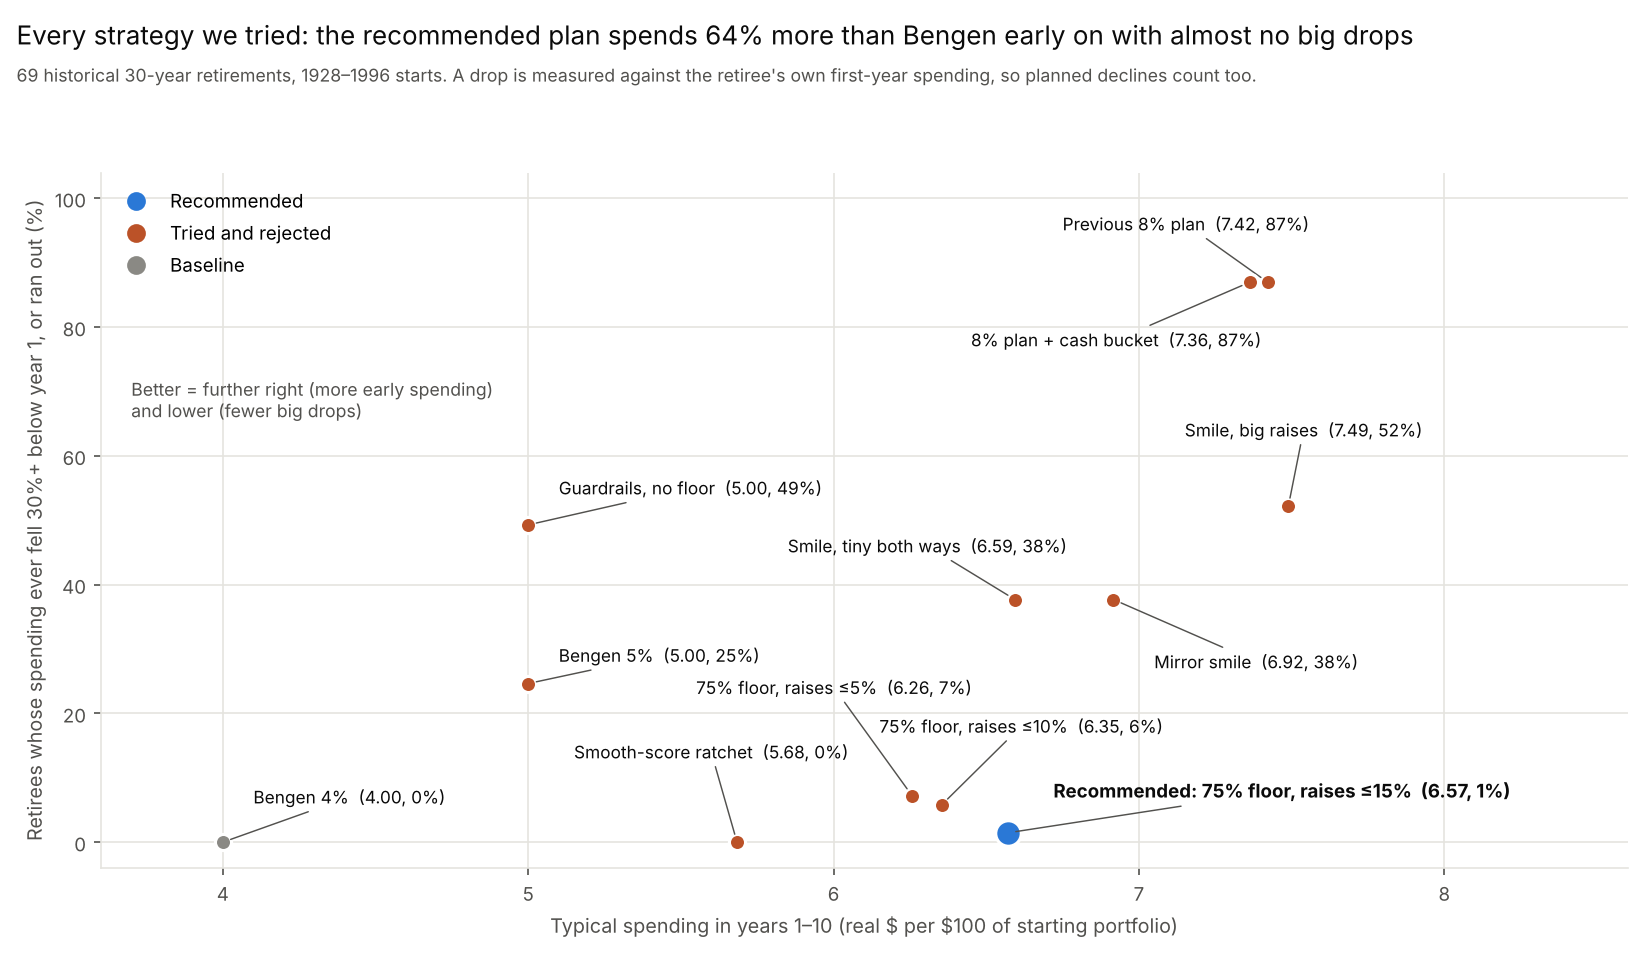
Each idea below was tested on the same 69 retirements and set aside; the chart places them all on two plain measures.
| Experiment | What we tried | Why it was set aside |
|---|---|---|
| Higher fixed rate | Bengen’s rule at 5% | A quarter of retirees ran out of money |
| Guardrails without a floor | ±10% steps on a ±20% band | Cuts compound; the worst retirees fell to about $2 |
| Leverage | 125–200% stocks, borrowing at T-bills + 1% | Failed 4–16 of 69 retirees at any starting rate |
| Spending ceiling | Caps of 1–3× the plan | Never raised the safe starting rate; only grows the estate |
| Cash bucket | 10% cash spent first in downturns, refilled later | Moved the safe start by at most 0.2 points |
| Smooth-score ratchet | Optimised for steady spending: 4.8% start, never cut, raise 13% when ahead | Back-loads spending (yrs 1–10 $5.68, yrs 21–30 $10); needed 45% international |
| Spending smile, big raises | Plan declines by decade; cuts ≤5%, raises up to 32% | 91% of retirees give back 30%+ of their best year |
| Spending smile, tiny both ways | Cuts and raises both ≤5% | Lower early spending ($6.59) and 22% of retirees 30%+ below plan |
| Mirror smile | Plan dips for 20 years, then rises at the same rate | Typical spending stayed flat; the late rise ran 2 retirees out of money |
| 75% floor with small raises | 75% floor, raises ≤5% or ≤10% | 4–5 retirees ran out late; small raises never build a cushion |
| Earlier recommended plan | 6.1% start, −2.5%/yr plan, 75% floor, cut 5% / raise ≤13.6% | Tuned too closely to history: 13.7% ran out in reshuffled history, 6 of 69 with a 0.25% fee |
| Rising-stock glidepath | 50–70% stocks rising to 95–100% | +8% in real history; out of history +0.4% at best, and history-tuned versions ran out in 20% |
| CAPE-aware amortization | Spend what amortizes the portfolio at a valuation-based return | +9% in real history; history-tuned version ran out in 21% of reshuffled retirements |
| Amortization, no hard floor | TPAW/ABW-style, smoothed | +7% out of history, but a third of retirees spend below $39,000 at some point |
| Smaller raises instead of a cap | Blanchett path, raises ≤5% | Raises still piled up: typical year-30 spending $65,000 against a planned $44,000 |
Caveats and takeaways
The optimized rates fit one history and should be read as an upper bound, not a plan.
Caveats
- In-sample fit. 69 overlapping periods hold only a handful of independent bad sequences. The recommended plan is tuned on reshuffled history to reduce this, but reshuffling breaks the tendency of returns to even out over decades and can’t create crashes worse than 1928–2025.
- US and developed markets only. Results are for a retiree spending US dollars over 1928–2025; they may not carry over to other countries or to the future.
- Data proxies. Bonds are a T-bill/10-year blend; international returns splice JST (1928–69) to MSCI (1970 on).
- No fees or taxes. A 0.5–1% annual cost would lower every rate.
- Fixed 30-year horizon and no other income such as pensions or Social Security.
- Variable income. About one retiree-year in five is spent at the floor, and on the 8% plan most retirees live through a cut of 30% or more.
Takeaways
- Bengen’s 4% is a sound floor: it never failed in this data.
- If spending can flex, a hard floor plus large guardrail steps is what makes a higher start safe.
- Hold roughly 70–80% stocks, with about a quarter abroad.
- Front-load only by letting the minimum fall too; a ceiling is an estate decision, not a safety tool.
- Avoid leverage. A cash bucket is harmless but adds little; hold one for peace of mind, not a higher rate.
- Use the recommended plan: start at 6.5%, let planned spending follow retirees’ observed pattern (about −1% a year), never more than 10% above it or below 42% of the first year, and cut 8.5% or raise up to 15% when the withdrawal rate moves 22% from the start. The leftover funds long-term care.
- Test a plan beyond the history it was tuned on. A floor that history alone supports can fail 1 time in 7 out of sample, and every 0.25% of fees matters.
Reproducing the results
The Python project (pandas, numpy, matplotlib) regenerates every number and chart here from the bundled data in under a minute per script.
| Script | What it produces |
|---|---|
scripts/reproduce.py |
Bengen replication: longevity by start year, allocation table, 30-year maximum rates |
scripts/guardrails.py |
Guardrails vs Bengen across step sizes, with optional floor and ceiling |
scripts/optimize.py |
Best stocks × step × ceiling × drift at a chosen success rate (--success 0.95) |
scripts/intl_sweep.py |
Safe start vs international share, base and stress series |
scripts/safemax_variants.py |
Highest safe start by retirement year for the four variants |
scripts/explain_guardrails.py |
Year-by-year guardrail decisions for chosen retirees, plus how often the rule acts |
scripts/pain_analysis.py |
How often each level of spending cut happens, by strategy |
scripts/cash_bucket.py |
Cash bucket vs no cash and static cash, with cash-size and trigger sensitivity |
scripts/decline_optimize.py, scripts/decline_charts.py |
Recommended plan: declining spending with a 75% floor and capped raises, optimised and charted |
scripts/experiment_map.py |
Every strategy tried on one chart: early spending vs big drops |
scripts/smooth_optimize.py, smile_optimize.py (+ charts) |
The smooth-score and spending-smile experiments |
scripts/build_intl.py |
Rebuilds the international return series from the JST dataset |
scripts/alt_optimize.py |
Recommended plan and the alternative strategies, tuned on history or reshuffled history (--boot 2000 --max-out 0.02) |
scripts/alt_robust.py, scripts/alt_charts.py |
Stress tests (fees, reshuffled history, other settings) and charts |
scripts/plan_summary.py |
The recommended-plan comparison table |
scripts/bengen_bootstrap.py |
Bengen’s 4% rule on reshuffled history: failure rate and safe rates by stock share |
app/dashboard.py |
Interactive dashboard for tuning the recommended plan |
Defaults: intermediate-bond proxy, year-end withdrawals, ±20% guardrail band, 25% international in the experiment scripts (--intl 0 for US-only).
Sources
- Damodaran, Historical Returns on Stocks, Bonds and Bills
- US Inflation Calculator, historical inflation rates
- Jordà-Schularick-Taylor Macrohistory Database R6 (copy used), licensed CC BY-NC-SA 4.0. Cite: Jordà, Schularick and Taylor (2017), “Macrofinancial History and the New Business Cycle Facts”, NBER Macroeconomics Annual 2016, vol. 31; and Jordà, Knoll, Kuvshinov, Schularick and Taylor (2019), “The Rate of Return on Everything, 1870–2015”, Quarterly Journal of Economics 134(3)
- MSCI World ex USA annual returns
- MSCI EAFE index factsheet
- William P. Bengen, “Determining Withdrawal Rates Using Historical Data”, Journal of Financial Planning, October 1994
- Early Retirement Now, Retirement Bucket Strategies (SWR Series Part 48)
- Kitces, Research Reveals Cash Reserve Strategies Don’t Work Unless You’re a Good Market Timer
- Estrada, “Does the Bucket Approach Destroy Wealth?” (Advisor Perspectives)
- Social Security Administration, Actuarial Life Table (2022 period, 2025 Trustees Report)
- David Blanchett, “Exploring the Retirement Consumption Puzzle”, Journal of Financial Planning, May 2014
- J.P. Morgan, Retirement by the Numbers (PlanAdviser summary)
- Kitces, Guyton-Klinger vs risk-based guardrails
- Early Retirement Now, Dynamic withdrawal rates based on the Shiller CAPE (Part 54) and Equity glidepaths (Part 19)
- Advisor Perspectives, Flexible Withdrawal Strategies Using Certainty-Equivalent Spending
- White Coat Investor, Amortization-based withdrawal vs safe withdrawal rates
- Plansponsor, Vanguard’s dynamic spending rule
- Morningstar, What’s a safe retirement withdrawal rate for 2026?
- Robert Shiller, CAPE data
- Kitces on Blanchett’s retirement spending smile and safe withdrawal rates with decreasing spending
Licence
The international figures and charts in this write-up use data derived from the JST Macrohistory Database and are shared under CC BY-NC-SA 4.0: non-commercial use only, with attribution, under the same licence. The code is MIT-licensed.